Visual Vocabulary
Contenidos
mostrar
Información
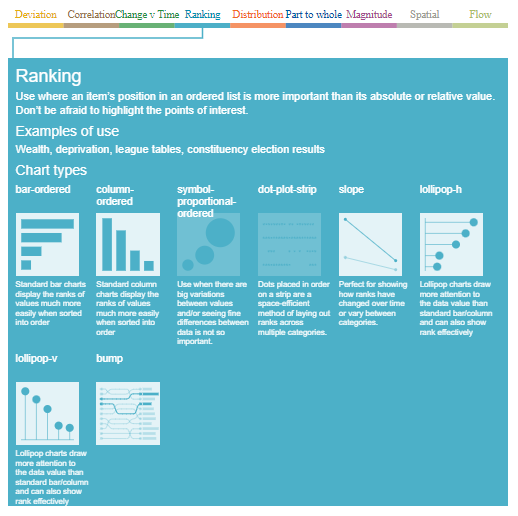
There are so many ways to visualise data – how do we know which one to pick? Click on the coloured categories below to decide which data relationship is most important in your story, then look at the different types of chart within the category to form some initial ideas about what might work best. This list is not meant to be exhaustive, nor a wizard, but is a useful starting point for making informative and meaningful data visualisations. 1
